oxvik* is the creative cooperative of
Jon Hicks and Brian Suda.
Together, we provide a wide range of skills and experience for your project, from discovery workshops to prototyping and building your idea. If it's data you've got, we’ll help you make sense of it through analysis, reporting and data visualisations.
We have worked with many companies in different ways. Here is just a sample:
Illustration
Iconography Principles
Identity Design System
Iconography
Data Visualization, Analytics
Dashboards, data visualizations
Front/Backend Software development
Writing, Data Analysis, Reporting
Jon Hicks : ox

Jon Hicks is a graphic designer based in Oxfordshire, United Kingdom. He has more than twenty years print & digital experience for clients like Dyson, Mozilla, Spotify, DuckDuckGo and Skype.
While Jon’s work covers a broad spectrum of graphic design, he is most well known for his logo work for Firefox, Mailchimp and Shopify. He particularly enjoys helping companies create their visual language from scratch.
Jon is the author of ‘The Icon Handbook’ as well as podcaster with his thematic music show Troika.
Brian Suda : vik

Brian Suda is an informatician currently residing in Reykjavík, Iceland.
With a Masters degree in Computer Science from the University of Edinburgh, Brian has gone on to create and own a variety of companies; an Educational Research company in Iceland which is changing the way education and funding is conducted within schools, a Text-Analysis company which was sold to JIVE Software in 02013 for nearly $10M, and helped plan the next generation of the TestFlight app before being acquired by Apple.
Most recently, he has been focusing more on the mobile space: how smaller devices will augment our everyday life and what that means to the way we live, work and are entertained.
Our Publications

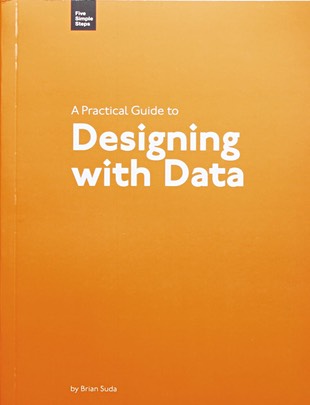
Designing with Data
Designing with Data is a visual feast. With over 200 illustrations, Brian leads you by the hand through the early history of charts and graphs through to complex visualisations. If you need to display data in any form, you need this book.
The Icon Handbook
Have you ever needed to create an icon, and not known where to start? The Icon Handbook is the only reference manual, how-to guide and coffee-table-book-in-one for icons and pictograms. Rather than teach you how to draw in a particular application, it takes you through the complete process of creating an icon, from discovering the right metaphor right through to deployment.

O'Reilly 2017 Software Development Salary Survey
This report explores the landscape of the professionals working in all facets of software development, including details about the relationship between roles, location, company size, industry, and earnings. We paid special attention to the variables that correlate with salary, but it’s not just about money: we also analyzed what tools, tasks, and organizational processes respondents most commonly use.
Availability Forecast: Fair to Good
Please email us at info@oxvik.com, we’d love to talk to you about your project. We have availability from January 2023 onwards.
Or veer to Twitter @WeAreOxvik for moderate updates and occasional showers.